- Key Insights
- Regional Analysis of Car Accident Trends Across Canada
- Car Accident Trends in Halifax
- Demographic Breakdown of Car Accident Trends
- Costs and Consequences of Rising Car Accident Trends
- Interventions and Solutions to Rising Car Accident Trends in Halifax
- The Future of Road Safety in Halifax
- References
Key Insights
| According to the Halifax Road Safety Dashboard, the city had a total of 6,039 traffic incidents in 2024. The same report shows that between 2018 and 2021, 2020 had the lowest rate of collisions, at just 4,561 incidents. Statistics Canada reveals that the national rate for car accident fatalities was 5 per 100,000 people in 2022. Another report by Statistics Canada illustrates how drivers held the largest percentage of road fatalities and serious injuries in 2022, at 49.3% and 47.3%, respectively. Transport Canada reports that in 2022, the total social cost of car accidents in Canada amounted to $35,979.49 million CAD. |
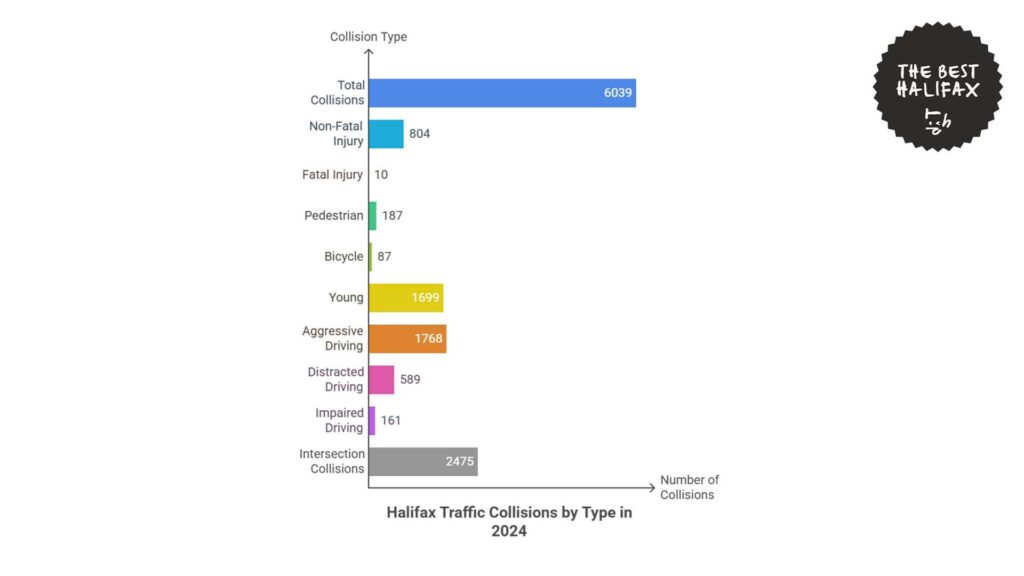
The Halifax Road Safety Dashboard shows that in 2024, Halifax had a total of 6,039 traffic incidents.
Among the total number of accidents, 804 were caused by non-fatal injuries. As for more severe cases, there was a total of 10 fatal incidents.
There were also 87 bicycle collisions in 2024, showing that cyclists continue to be a regular group victimized by traffic accidents.
Meanwhile, pedestrian collisions also accounted for 187 of the total number of incidents. This shows how vehicular accidents can impact even bystanders.
Combined, these figures show the vulnerability of road users who do not use cars, especially in locations where roads and public spaces are shared.
Driver conduct was a main contributor to the total number of collisions. Aggressive driving accounted for 1,768 cases, which is the highest number among the recorded behavioral causes.
Distracted driving accounted for 589 collisions, showing that there is still a need to enforce proper driver attention in the city.
Meanwhile, impaired driving was responsible for 161 cases. While this is lower in number than other behavioral causes, it remains a notable concern due to the severity often associated with impaired-driving incidents.
Intersections were identified as the location of 2,475 of all recorded collisions. This means that around 41% of the total number of collisions in Halifax occurred at intersections, which raises safety concerns for these areas.
This pattern could be because intersections are more vulnerable to collisions, particularly due to the volume of vehicle interactions, lane changes, and crossing movements.
Regional Analysis of Car Accident Trends Across Canada
Statistics Canada shows how road safety numbers across Canada have notable differences between provinces when looking at both fatality and injury rates per 100,000 population.
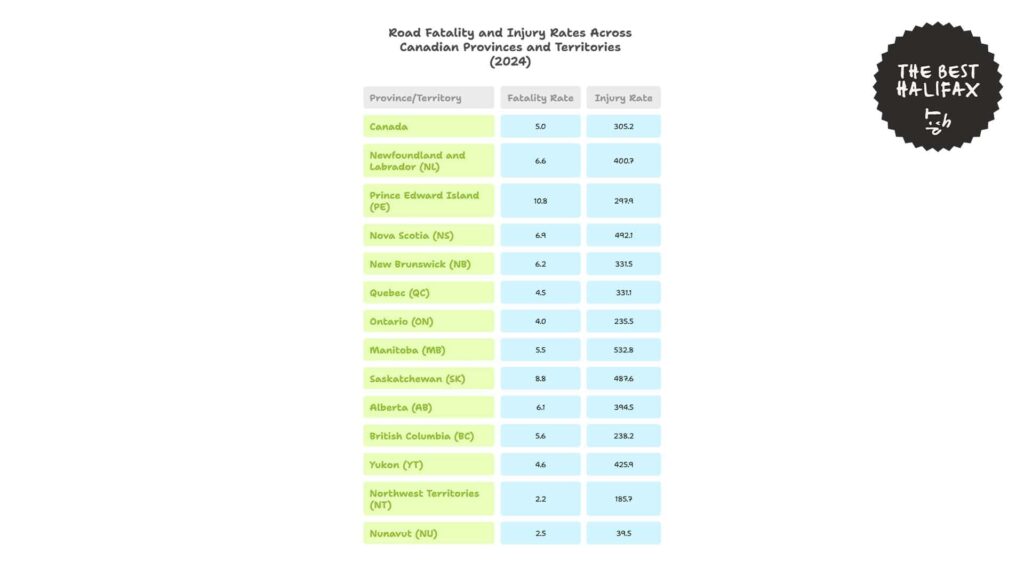
In 2022, the national rate was 5 fatalities and 305.2 injuries per 100,000 people. However, many provinces exceeded these numbers.
Prince Edward Island reported the highest fatality rate at 10.8 per 100,000 people, making it more than double the national average.
Saskatchewan followed with 8.8 fatalities per 100,000 people. This rate is then followed by Nova Scotia, which reported 6.9.
Newfoundland and Labrador also exceeded the national average with 6.6. Following close behind were New Brunswick at 6.2 and Alberta at 6.1.
Meanwhile, British Columbia had a rate of 5.6, while Manitoba had 5.5. These are both slightly above the Canadian average.
These eight provinces reported the highest rates in the country, suggesting a greater incidence of deadly road incidents relative to population.
In contrast, several regions had rates below the national level. Yukon recorded 4.6 fatalities per 100,000 people, while Quebec had 4.5.
Ontario followed closely with a rate of 4. The Northwest Territories and Nunavut had the lowest fatality rates at 2.2 and 2.5, respectively.
The data also reveals notable trends when it comes to accidents involving injuries.
Manitoba recorded the highest injury rate in Canada at 532.8 per 100,000 people. This is 74.6% higher than the national rate of 305.2.
Nova Scotia and Saskatchewan also reported high injury figures at 492.1 and 487.6, respectively. It is worth noting that these provinces showed both high fatality and injury rates, which indicates more road safety challenges for these areas.
Yukon had an injury rate of 425.9, followed by Newfoundland and Labrador at 400.7 and Alberta at 394.5.
Meanwhile, New Brunswick and Quebec reported nearly identical injury rates at 331.5 and 331.1, which are slightly higher than the Canadian rate.
Prince Edward Island, despite leading in fatality rates, had an injury rate of 297.9, which is just below the national average.
Provinces with the lowest injury rates included Ontario at 235.5 and British Columbia at 238.2. These two provinces had both fatality and injury rates significantly below national levels.
Finally, the Northwest Territories reported 185.7 injuries per 100,000, and Nunavut had the lowest in the country at just 39.5.
These figures suggest that fewer injuries were reported in these northern regions, possibly due to differences in transportation infrastructure, vehicle usage, or population distribution.
Car Accident Trends in Halifax
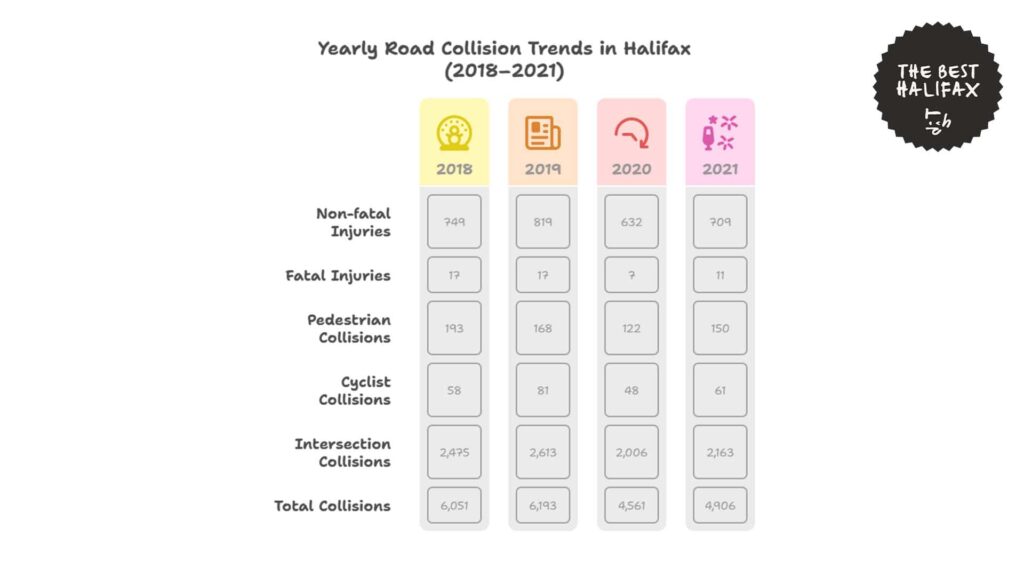
The Halifax Road Safety Dashboard shows that between 2018 and 2021, Halifax experienced sharp yearly changes in traffic crashes, both in the number and severity of the crashes.
In 2018, Halifax had a total of 6,051 collisions. Of these, 749 led to non-fatal injuries and 17 led to fatalities.
During the same year, there were also 193 pedestrian-related collisions and 58 cyclist-related collisions, while 2,475 of the total cases occurred at intersections.
In 2019, total collisions reached 6,193, which is a 2.3% increase from the previous year. Non-fatal injuries also rose to 819, which is a 9.3% increase, while the number of fatal injuries was steady at 17.
Pedestrian and cyclist collisions decreased by 13.0% to 168, while cyclist collisions grew to 81, which is a 39.7 % increase. Intersection collisions also grew to 2,613, a 5.6 % increase from 2018.
Notably, a significant drop was seen in 2020 for almost all categories, likely due to the COVID-19 pandemic. Overall, collisions fell to 4,561, which is down 26.3% from 2019.
Non-fatal injuries also went down to 632, which is a decrease of 22.8 %, and fatal injuries fell to 7, or down 58.8 %.
Pedestrian collisions fell to 122, which is down 27.4 %, and cyclist collisions fell to 48, or a decrease of 40.7 %.
Intersection-related incidents also fell significantly, from 2,613 in 2019 to 2,006 in 2020, which is a fall of 23.2 %.
In 2021, the number of collisions rose again, although not to pre-2020 numbers. Overall, collisions climbed to 4,906, which is an increase of 7.6% from 2020.
Meanwhile, non-fatal injuries also increased to 709, which is a 12.2 % rise. Fatal injuries climbed to 11, an increase of 57.1% from the prior year.
Pedestrian-involved collisions increased to 150, or a 23.0% rise, and cyclist crashes also went up to 61, which is a 27.1% increase. Similarly, intersection crashes climbed to 2,163, which is a 7.8% rise from 2020.
These minor increases may have been the result of the relaxation of quarantine and pandemic policies.
For the entire four-year duration, the peak figures for total collisions and non-fatal injuries were in 2019, while 2020 had the lowest values in almost all categories.
Demographic Breakdown of Car Accident Trends
Data from Statistics Canada shows how the victims of car accidents are disproportionately affected.
Fatalities and Serious Injuries by Road User Class
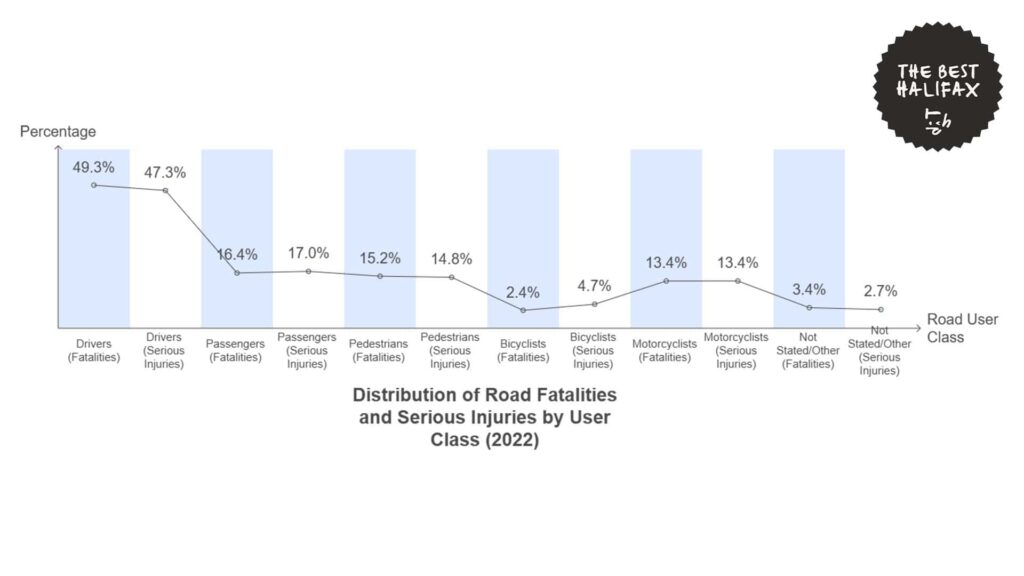
In 2022, drivers held the largest proportion of both road fatalities and serious injuries related to traffic in Canada.
Drivers comprised 49.3% of all road fatalities and 47.3% of all serious injuries. These statistics show that close to half of the worst traffic consequences involved the drivers of vehicles.
Following this, passengers made up the second-highest proportion, with 16.4% of fatalities and 17.0% of serious injuries. These figures indicate that passengers are still considerably impacted in serious collision incidents.
During the same year, pedestrians recorded 15.2% of fatalities and 14.8% of serious injuries.
This indicates that even for people outside of vehicles, there is still a significant level of danger faced from car accidents. This number even puts them at almost the same amount of risk as passengers inside vehicles.
Meanwhile, motorcyclists accounted for 13.4 % of both deaths and severe injuries. This emphasizes the seriousness of injuries in motorcycle accidents, frequently caused by minimal physical protection in contrast to passengers in enclosed vehicles.
Bicyclists made up 2.4% of deaths and 4.7% of severe injuries. The difference between the two implies that while bike crashes are less likely to be fatal, they often still lead to significant trauma or damage.
Finally, road users whose category was unspecified or other comprised 3.4% of deaths and 2.7% of severe injuries.
Driver and Passenger Fatalities and Serious Injuries by Age Group
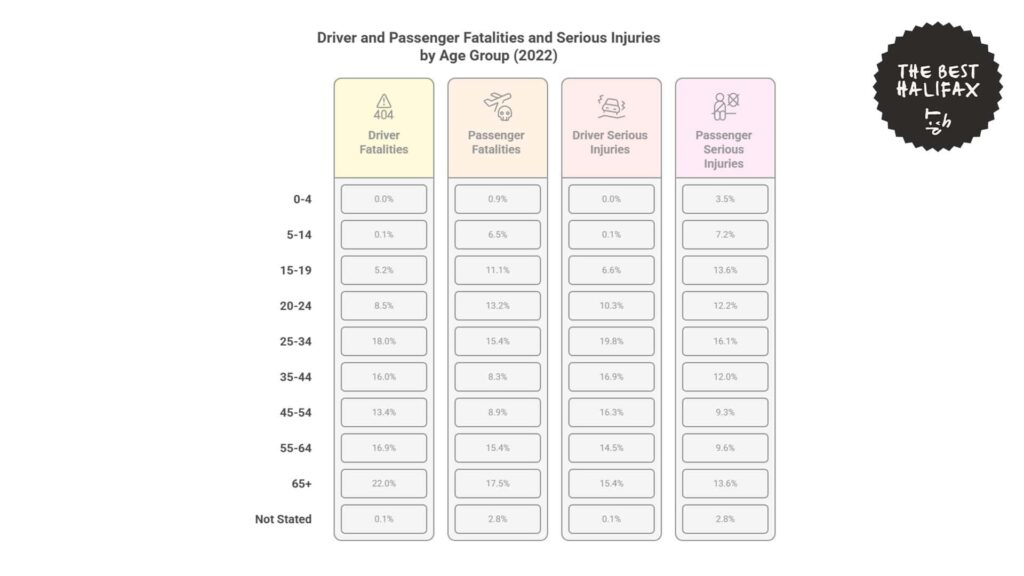
Fatality and serious injury rates among drivers and passengers also varied significantly across age groups in Canada.
Among drivers, those aged 65 and older accounted for the highest share of fatalities at 22.0%. This is followed by drivers in the 25 to 34 age bracket at 18.0%, 35 to 44 at 16.0 %, and 55 to 64 at 16.9%.
Drivers in the 45 to 54 age bracket contributed 13.4%, and young adults aged 20 to 24 made up another 8.5 %.
As for younger victims, teenage drivers in the 15 to 19 age bracket contributed 5.2% to driver fatalities.
Notably, the age bracket 15 to 14 years old contributed to 0.1% of driver fatalities. While this is a very small percentage, it shows that there is an ongoing issue with underage drivers.
For passengers, the largest percentage of fatalities was also recorded in the 65 and above group, which accounted for 17.5% of all passenger fatalities.
Passengers between 25 and 34 and 55 and 64 years old each accounted for 15.4%, and 20 to 24-year-olds accounted for 13.2%.
Within the mid-adult age groups, 8.9 % was recorded between 45 and 54 years and 8.3% between 35 and 44 years.
Young people between 15 and 19 accounted for 11.1% of passenger victims. Meanwhile, children between 5 and 14 accounted for 6.5%, and those under 5 accounted for 0.9%.
For those suffering from serious injuries, drivers also faced similar trends.
The highest proportion of seriously injured drivers was in the 25 to 34 category at 19.8%, followed by 35 to 44 at 16.9% and 45 to 54 at 16.3%.
Drivers aged over 65 contributed 15.4%, while drivers aged 55 to 64 made up another 14.5%.
Severe injuries for younger drivers were also significant, at 10.3% for the 20 to 24 age group and 6.6 % for the 15 to 19 age group.
Passenger severe injuries were most common among the 25 to 34 years age group at 16.1%, followed by 15 to 19 years at 13.6%, and 65 years and above at 13.6%.
Younger passengers aged 20 to 24 accounted for 12.2%, while those aged 35 to 44 and 45 to 54 accounted for 12% and 9.3% respectively.
Children between 5 and 14 accounted for 7.2%, while children under five accounted for 3.5%.
In general, the data indicates that adults aged 25 to 64 comprise the majority of both driver and passenger fatalities and severe injuries.
While older adults have a higher share of fatalities, younger adults and middle-aged individuals account for most serious injuries, particularly among drivers.
Costs and Consequences of Rising Car Accident Trends
Transport Canada reports on the social costs of collisions in the country and how these costs impact citizens.
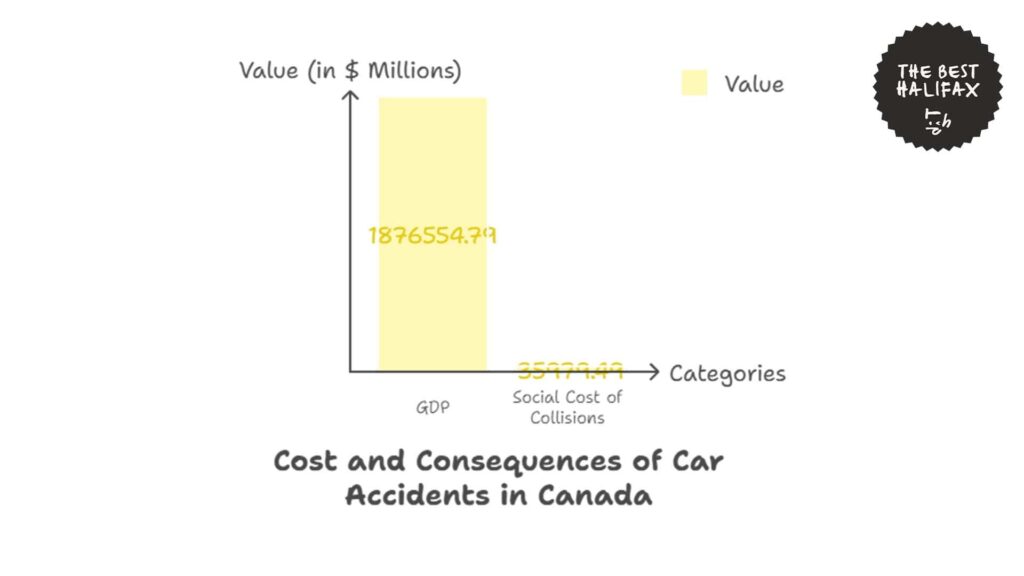
Traffic accidents in 2022 generated a total social cost of $35,979.49 million in Canada in 2010 Canadian dollars. The data includes both direct and indirect economic losses related to road crashes.
These comprise emergency response, medical costs, property loss, insurance payments, lost productivity time, and general declines in productivity within the economy.
Furthermore, this estimated economic cost accounted for 1.92% of the country’s gross domestic product (GDP) during that year, which was at $1,876,554.79 million.
This shows the impacts of car accidents on not just people but on the health of the nation’s economy.
When collisions occur frequently or result in severe injuries, the strain is felt not only by those directly involved but also by healthcare systems, government budgets, insurance systems, and the broader economy.
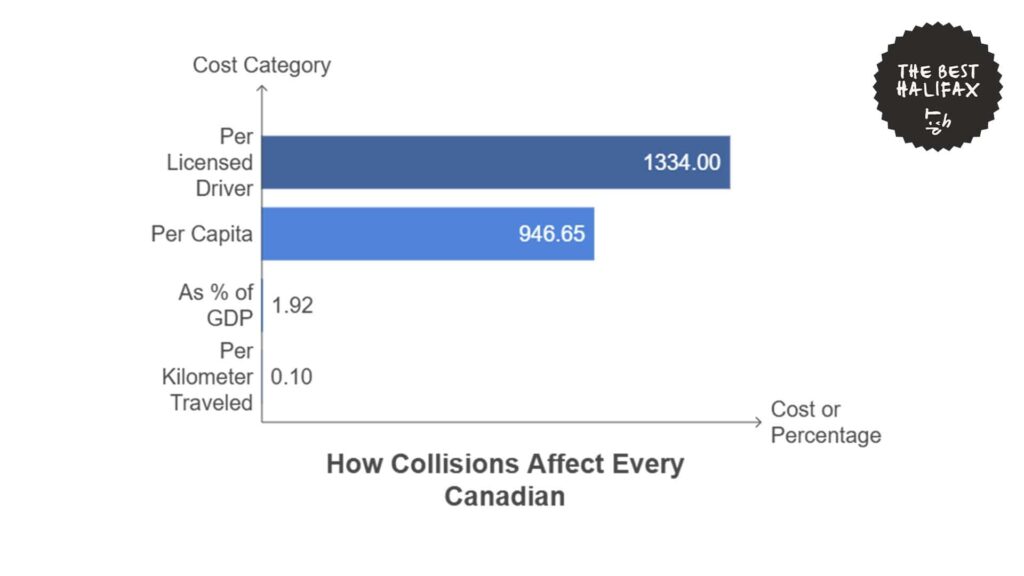
Beyond national totals, the dataset provides a breakdown of costs per person and per unit of road use.
The social cost per licensed driver in 2022 was $1,334.00, while the per capita cost was $946.65.
These values represent the average financial impact of collisions for every Canadian and every licensed road user, regardless of whether they were directly involved in an incident.
When viewed through road usage data, the cost per vehicle kilometer traveled was $0.10.
For cities like Halifax, where car use is common and total collisions remain in the thousands each year, these national averages help estimate the financial scale of road safety issues at the local level.
Interventions and Solutions to Rising Car Accident Trends in Halifax
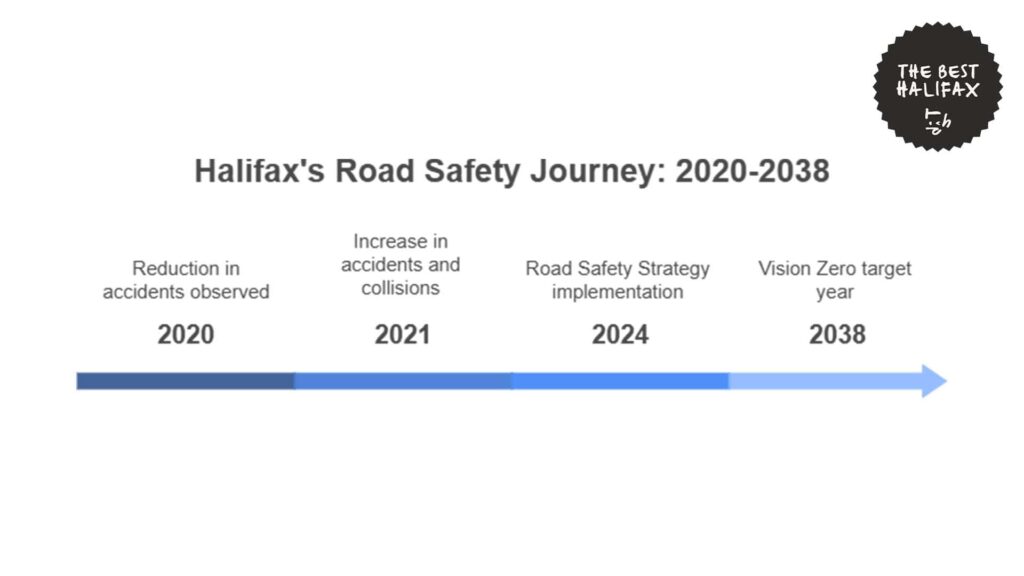
To address rising car accident trends, the Halifax Road Safety Strategy 2024 takes a Safe System Approach based on the Vision Zero philosophy, with a vision of achieving zero traffic-related deaths and serious injuries by 2038.
The Strategy has six core elements: Safe Road Users, Safe Roads, Safe Speeds, Safe Land Use Planning, Safe Vehicles, and Post-Crash Care.
Interventions to support these are provided through engineering, education, enforcement, engagement, and data management.
Prominent examples include traffic calming, intersection reconfigurations, and infrastructure improvements such as protected bike lanes, improved crosswalks, and speed cushions.
The city has also introduced education campaigns via social media and signage, though their evidence indicates that education will only be effective when supplemented by enforcement and redesign.
Meanwhile, efforts on the side of law enforcement target impaired, distracted, and aggressive driving, with the city still pushing for provincial law to permit automated speed enforcement.
Technology is also becoming increasingly relevant, with the application of video analytics, collision databases, and the development of a High Injury Network to inform project prioritization.
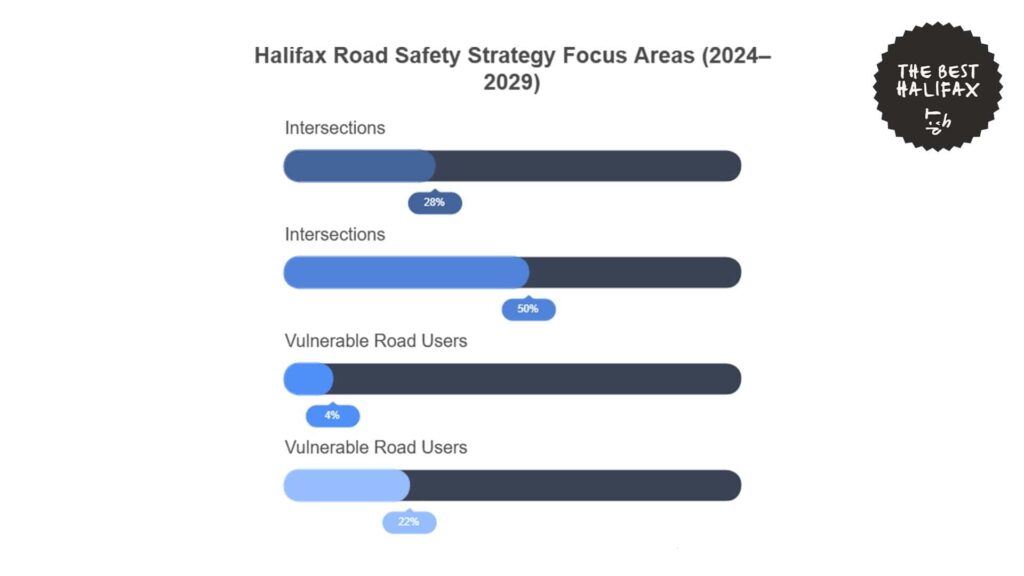
With this, the Road Safety Program maintains five priority focus areas in 2024–2029: intersections, speed management, vulnerable road users, school zone safety, and data analytics.
Since intersections are responsible for 28% of fatal and 50% of injury crashes, they serve as the priority for capital upgrades.
Speed management is also addressed by implementing 40 km/h residential zones, traffic calming, and policy efforts to provide municipalities with greater authority over local speed limits.
Similarly, incidents in school zones are addressed through more signs and active transportation projects targeted at younger people.
Furthermore, the report shows that vulnerable road users, who account for 4% of all crashes but 22% of fatalities and injuries, can be aided through the creation of safer sidewalks, lighting, and cycling facilities.
Lastly, increased data tools that assist staff in recognizing trends, assessing interventions, and tracking progress have also been implemented with the hope of ensuring the success of these projects.
Thus, the Road Safety Strategy also includes annual reporting on key performance indicators to ensure accountability and continuous improvement.
The Future of Road Safety in Halifax
According to recent trends, Halifax can expect to experience further fluctuations in car accidents and traffic collision rates over the upcoming few years.
Although there was a reduction in accidents seen in 2020, the steady increase in 2021 and 2024 indicates there is still a need to address structural issues for road safety in the city.
Meanwhile, success for Halifax’s Road Safety Strategy 2024 will most likely be seen in the long term.
For example, severe and fatal incidents could decrease through interventions at intersections, where 50% of injury collisions currently occur.
Ongoing emphasis on vulnerable road users will also be expected to assist in decreasing injury severity rates, most notably for cyclists and pedestrians who make up 22% of serious injury and 4% of all fatality rates.
The addition of High Injury Network mapping, along with a greater use of video analytics and collision databases, can also enhance the city’s capacity for identifying and responding to risk spots earlier.
Although Vision Zero by 2038 is still a distant target, existing programs and technologies can allow the municipality to make steady progress towards safer roads within the next few years.
References
- Halifax Regional Municipality. (n.d.). Road safety dashboard. https://www.halifax.ca/transportation/streets-sidewalks/road-safety/road-safety-dashboard
- Transport Canada. (2023). Canadian motor vehicle traffic collision statistics: 2022. https://tc.canada.ca/en/road-transportation/statistics-data/canadian-motor-vehicle-traffic-collision-statistics-2022
- MacGillivray Law. (n.d.). Halifax car accident statistics. https://macgillivraylaw.com/suing-after-a-car-accident/halifax-collision-statistics
- Transport Canada. (2020). Statistics on the social costs of collisions in Canada: 2020. https://tc.canada.ca/en/road-transportation/statistics-data/statistics-social-costs-collisions-canada-2020
- Halifax Regional Municipality. (2024). Road safety strategy 2024 [PDF]. https://cdn.halifax.ca/sites/default/files/documents/transportation/streets-sidewalks/attachment-1-road-safety-strategy.pdf
- South West Development Commission. (n.d.). Road safety improved in Halifax. https://swdc.wa.gov.au/road-safety-improved-in-halifax/
- CBC News. (2024, March 5). New Halifax road safety plan includes better data, targeted projects. https://www.cbc.ca/news/canada/nova-scotia/new-halifax-road-safety-plan-includes-better-data-targeted-projects-1.7185556