
Key Insights
| According to Statistics Canada, a total of 1,965 individuals used bicycles as their primary mode of commuting to work in Halifax in 2016. The 2021 Halifax Census shows that between 2016 and 2021, the number of bicycle commuters in the city dropped by 41.7%. Another study by Statistics Canada reveals that in 2014, only 26.8% of respondents reported cycling in the past year. Data from the Halifax Dashboard illustrates that between 2019 and 2025, South Park Street had the greatest total bicycle volume among Halifax streets, at 428,000. The same dashboard also found that the Macdonald Bridge Bikeway recorded the highest average daily volume of cyclists, at an average of 275 per day. |
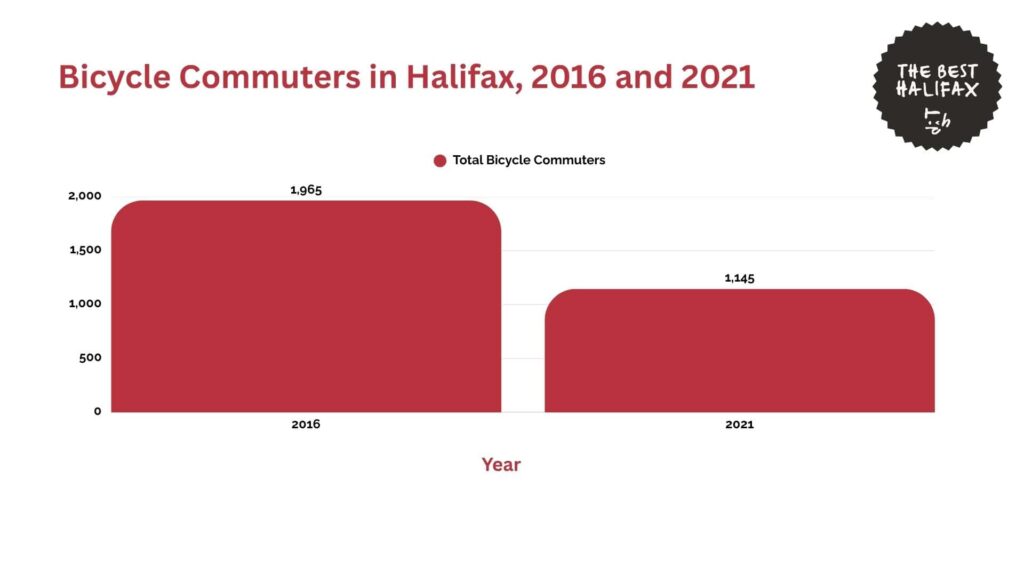
Statistics Canada shows that in 2016, there were a total of 1,965 individuals who used bicycles as their primary mode of commuting to work in Halifax.
Meanwhile, there were a total of 2,480 bicycle commuters across the province of Nova Scotia.
However, the 2021 Halifax Census shows that the number of bicycle commuters in the city dropped to 1,145. This is a 41.7% decrease in a period of just five years.
The decline may be linked to a range of possible factors, such as an increase in remote work or broader shifts in transportation habits following the COVID-19 pandemic.
This change raises important considerations for future transportation planning and cycling infrastructures in Halifax.
Regional Analysis of Cycling Trends Across Canada
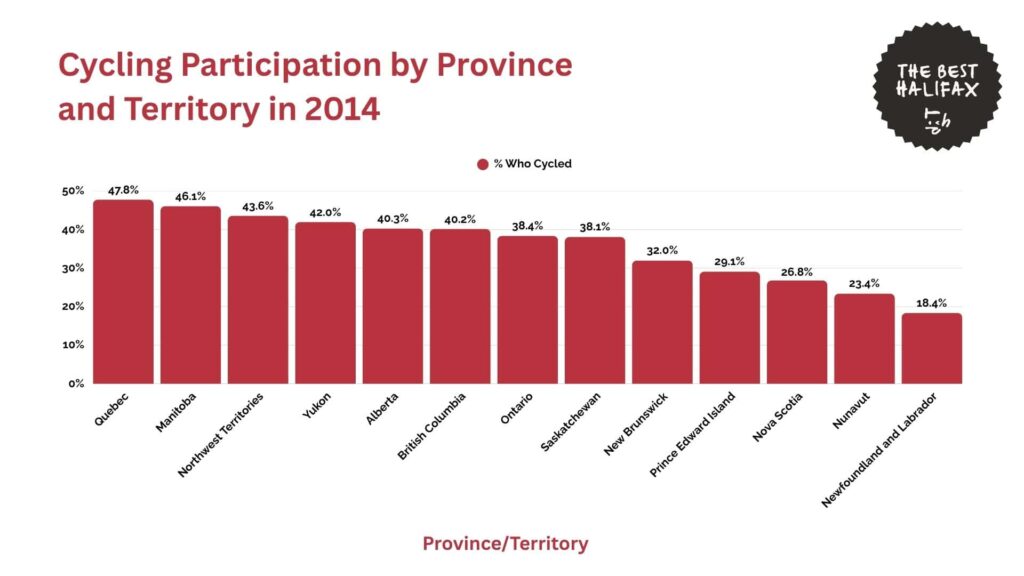
A 2014 survey by Statistics Canada shows the rate of cycling participation in various provinces across Canada.
In Nova Scotia, 26.8% of respondents reported cycling at least once in the previous 12 months. This ranks the province lower than most of the other regions of Canada, as Nova Scotia is in the third lowest place on the list.
Newfoundland and Labrador had the lowest percentage of cycling participation at 18.4%. This is 8.4 percentage points lower than Nova Scotia.
Slightly higher than this is Nunavut’s rate of 23.4, which is right below Nova Scotia’s by only 3.4 percentage points.
Prince Edward Island’s cycling rate was slightly above that of Nova Scotia at 29.1%, or 2.3 percentage points higher.
Meanwhile, New Brunswick had a participation rate of 32.0%. That is 5.2 percentage points greater than Nova Scotia.
Saskatchewan follows this at 38.1%, or 11.3 points above Nova Scotia. Similarly, Ontario had a rate of 38.4%, which is 11.6 points more than Nova Scotia.
British Columbia had an average of 40.2%, which is 13.4 percentage points greater than Nova Scotia.
Close to this is Alberta’s rate of 40.3%, which is 13.5 points above Nova Scotia. Cities like Calgary also have established bike lanes and trail systems, which could promote greater cycling in this region.
Near the top of the list, Yukon had a cycling rate of 42.0%, or 15.2 percentage points greater than Nova Scotia.
The Northwest Territories had a cycling participation rate of 43.6%, or 16.8 points higher than Nova Scotia.
In second place, Manitoba had a rate of 46.1%, which was 19.3 percentage points higher than Nova Scotia.
Finally, Quebec had the highest rate in the nation at 47.8%, or 21 percentage points higher than Nova Scotia. This also means that close to half of the residents reported cycling in the past year.
Overall, the numbers show that Nova Scotia’s cycling rate is quite low, even when compared to smaller provinces or territories.
City-Level Cycling Trends in Halifax
The Halifax Dashboard and Statistics Canada give relevant information on various cycling trends in the city, using data from 2019 to 2025.
Total Cycling Volumes on Halifax Streets
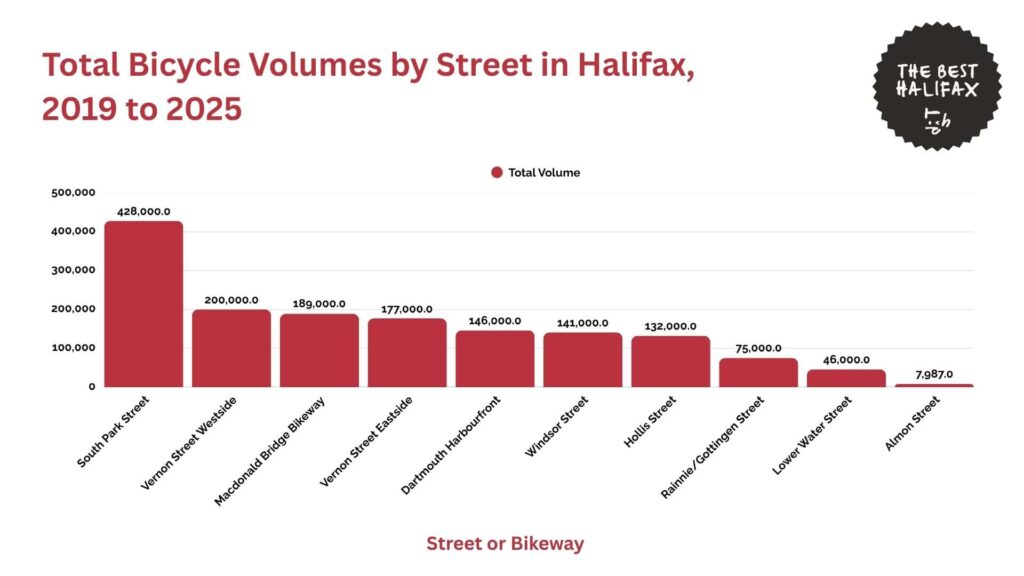
Between September 2019 and May 2025, Halifax measured bicycle volume on numerous significant streets in the city.
South Park Street had the city’s greatest total bicycle volume at 428,000. The street also had 9 average cyclists per hour.
The largest single-day total was 731 bikes, and in the busiest hour, 112 cyclists were counted. This stable high usage indicates that South Park Street is a regular cycling route for many residents.
Meanwhile, the Macdonald Bridge Bikeway had a total of 189,000 bicycles counted during the same period, with an hourly average of 11 per hour.
It had the highest peak day count of any site, with 915 cyclists. Its busiest hour was 140 cyclists, which was during morning rush hours.
Vernon Street, both its westside and eastside sections, totaled 377,000 cyclists. The westside registered a total of 200,000 cyclists while the eastside tallied 177,000 total cyclists.
Daily peaks were very close to being the same, with 371 bikes on the westside and 370 on the eastside. Peak hour traffic counts were 78 and 79, respectively.
Dartmouth Harbourfront Greenway tallied 146,000 total bikes, with an average of 4 per hour. Its peak day had 328, and its peak hour had 47 cyclists.
Following this, Windsor Street had 141,000 total cyclists, also averaging 4 per hour. Its busiest day saw a total of 256 bicycles, and 41 cyclists were observed during the peak hour.
Hollis Street had the next highest total bicycle volume of 132,000, with an average of 3 per hour. The busiest day recorded 264 bicycles and 52 cyclists during the peak hour.
On the lower end, Rainnie and Gottingen Streets counted 75,000 total bicycles. This area averaged 5 cyclists per hour. The highest number was 291, with a peak hour total of 73.
Lower Water Street saw 46,000 total bicycles, with an hourly average of 3. The highest number was 193, and the most within an hour was 41 bicycles.
Finally, Almon Street registered the lowest overall, with 7,987 cyclists. It had an average of 5 per hour, and the highest amount it saw in a day was only 253 bicycles.
Overall, routes such as South Park, the Macdonald Bridge Bikeway, and Vernon Street see the highest volumes of traffic regularly.
Average Daily Bicycle Volume on Halifax Streets
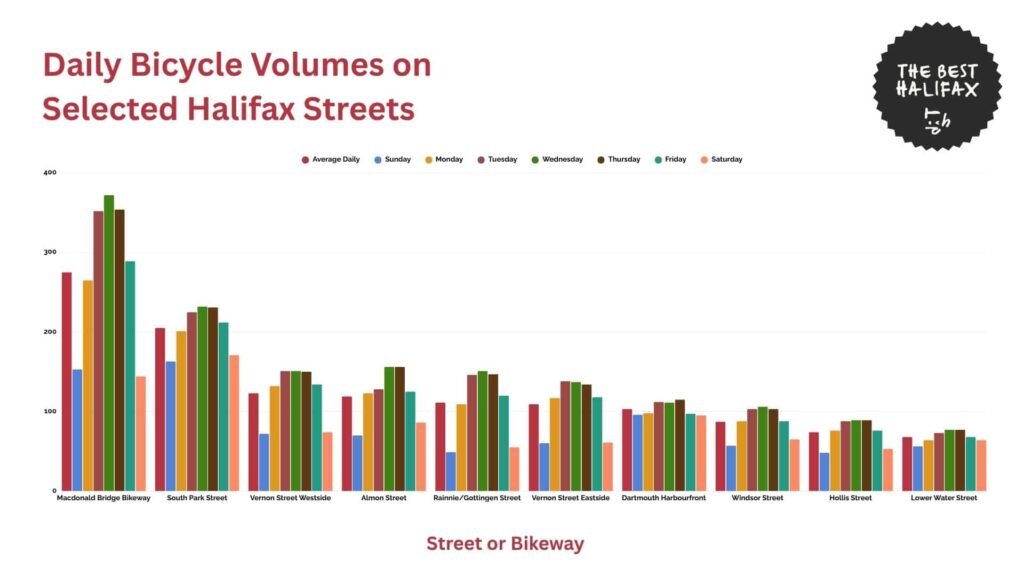
The Halifax Dashboard also shows the breakdown of average daily cycling on various Halifax streets, with some areas showing greater usage throughout the week.
The Macdonald Bridge Bikeway recorded the highest average daily volume among all locations. Across the seven days of the week, it averaged 275 cyclists per day.
Volumes were particularly high on weekdays, peaking on Wednesday with 372 riders and remaining above 280 from Monday to Friday.
Even on weekends, bicycle usage remained strong with 153 cyclists on Sunday and 144 on Saturday.
South Park Street followed with an average of 205 cyclists per day. Traffic was strong across the workweek, reaching a high of 232 on Wednesday and staying above 200 from Monday to Friday.
Weekends were a bit lower, at 163 on Sunday and 171 on Saturday.
Almon Street had a daily average of 119 cyclists. The busiest volumes were on Tuesday and Wednesday, both reporting 156 cyclists.
Vernon Street Westside had a daily average of 123 cyclists. Though weekday volumes were higher, between 132 and 151, weekend volumes fell to 72 on Sunday and 74 on Saturday.
Rainnie and Gottingen Streets averaged 111 cyclists for the day. The highest usage was on Thursday at 147 cyclists.
Vernon Street Eastside experienced a slightly lower average daily usage of 109 per day. Use was comparatively uniform on weekdays, peaking at 137.
Dartmouth Harbourfront had 103 cyclists daily on average. Wednesday and Thursday had the highest volumes on this route, with approximately 115.
Windsor Street saw an average of 87 daily cyclists, with a weekday high of 106 on Wednesday. Weekend traffic was much lower, at 57 on Sunday and 65 on Saturday.
Hollis Street was slightly lower at a daily average of 74, though weekday rates were still fairly high, especially on Thursday, with 147 cyclists.
The lowest average was reported by Lower Water Street, with 68 cyclists daily. Weekday volumes were consistent at around 73 to 77, with the lowest volumes on Sunday at 56 and Saturday at 64.
Trends in Bicycle Commuting Duration
According to a 2022 report by Statistics Canada, 1,160 people in Halifax used a bicycle as their regular means of commuting to work.
The greatest number of commuters were those who commuted between 15 and 29 minutes. This group comprised 520 cyclists and represented 44.8% of all cycling commutes.
415 cyclists, or 35.8%, had less than 15-minute commutes. These individuals are often the people who reside close to their workplace.
Medium-length commutes were not as common. There were 145 travelers, or 12.5% of the total, who indicated travel times of between 30 and 44 minutes.
Meanwhile, just 60 cyclists, or 5.2%, had trips between 45 and 59 minutes, and only 20 people, or 1.7%, had trips of 60 minutes or more.
These longer trips probably represent special situations, such as those residing outside the central urban area.
Generally, the average commute time for cycling in Halifax was 19.2 minutes.
This indicates that traveling by bicycle within the city is efficient overall, with nearly all cyclists taking less than 30 minutes to get where they are going.

Cycling Trends in Halifax by Gender
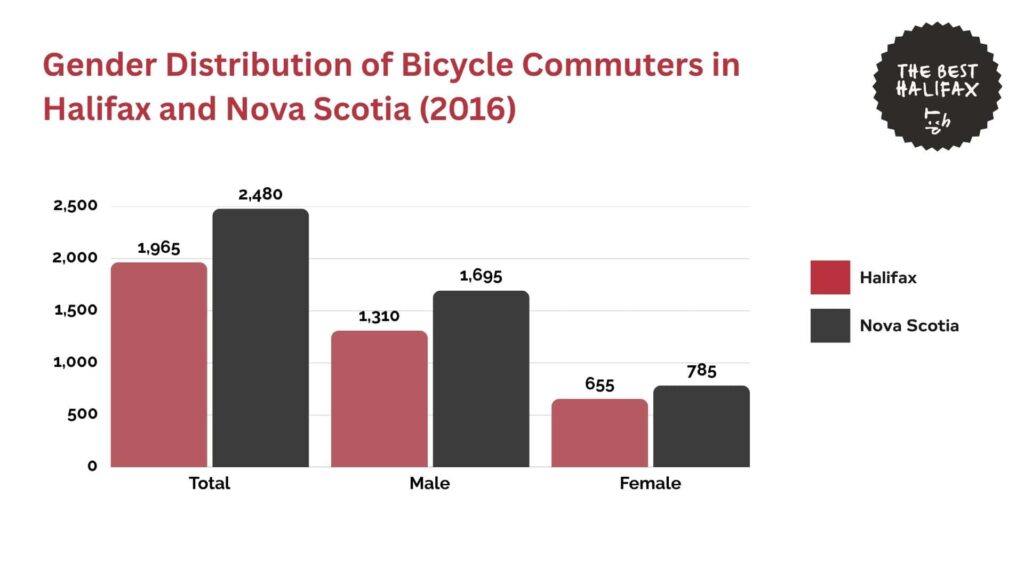
The 2016 Halifax Census shows that 1,965 residents depended on bicycles as their main means of commuting.
Of these, 655 were female and 1,310 were male. This indicates that 66.7% of Halifax bicycle commuters were male and 33.3% were female. The number of male cyclists was around twice the number of female cyclists.
Provincially, Nova Scotia had 2,480 bicycle commuters. Of these, 1,695 were men and 785 were women.
Similarly, the gender split shows that 68.3% of cyclists were male and 31.7% were female. The provincial gender ratio was a bit more uneven than for Halifax.
A closer look at the figures reveals that Halifax represented 77.3% of all male bicycle commuters in Nova Scotia. Among 1,695 male commuters in the province, Halifax had 1,310 of them.
For female cyclists, the ratio was even greater. Among the 785 female bicycle commuters in the province, 655 were from Halifax, representing 83.4% of the total.
These statistics reveal that the majority of bicycle commuting in Nova Scotia, both for men and women, occurs in Halifax.
Overall, in Halifax and throughout the province, men made up the largest proportion of cycling commuters.
This disparity in gender distribution indicates that men are much more likely to choose cycling as a main form of commuting, which may have to do with gender accessibility issues.
Benefits of Cycling in Halifax
Financial Benefits
An article by the Share the Road Cycling Coalition shows the various financial and personal advantages of cycling in Canada.
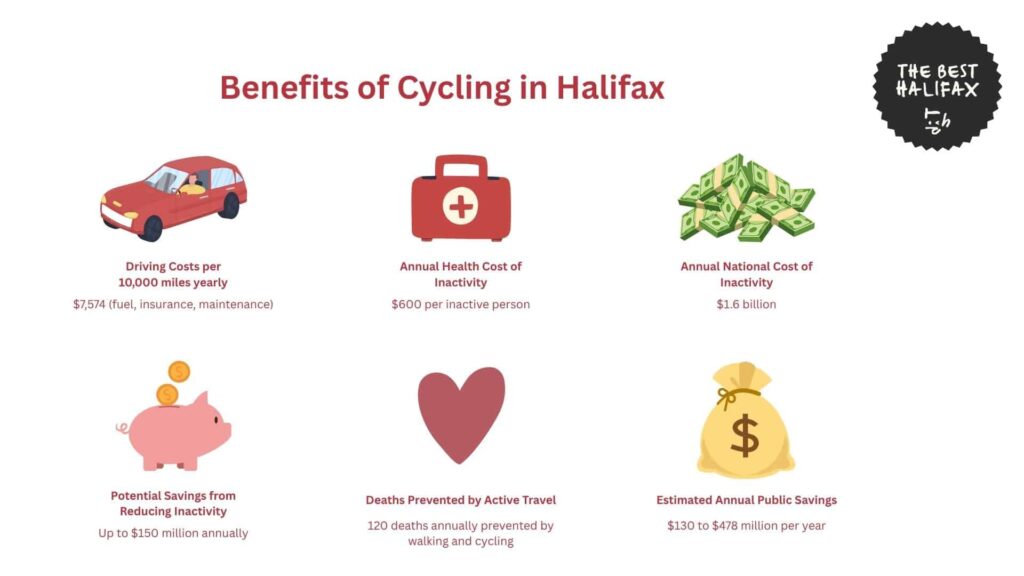
For Halifax, where the average bike commute is only 19.2 minutes and more than 80% of bike trips are less than 30 minutes long, cycling is efficient in terms of time as well as money.
Individuals can cut down on spending by eliminating the need for car maintenance or gas, which can be quite costly.
For instance, the article shows that driving a midsize car for 10,000 miles per year costs around $7,574. This includes fuel, insurance, and upkeep.
In comparison, the cost of cycling is minimal. Cyclists in Halifax face occasional maintenance or equipment expenses, but they avoid fuel costs, parking fees, and insurance premiums.
This makes cycling an especially practical and economical option for city residents traveling short to medium distances.
Health Benefits
The article also found that physical inactivity is a major driver of chronic disease and associated healthcare costs in the country.
Individuals who are physically inactive cost the health system more than $600 each year compared to active individuals.
Moreover, it was estimated that 1.5% of Canada’s total healthcare spending, at around $1.6 billion annually, is attributed to inactivity.
If physical inactivity levels were reduced, this would create direct savings of up to $150 million per year.
Individuals can also cut down on future medical expenses by getting regular exercise through cycling.
A study on cycling by the City of Toronto Public Health Department found that in 2006, walking and cycling were estimated to prevent approximately 120 deaths annually.
For cities, these savings amounted to between $130 million and $478 million per year. If cycling rates were increased by even just 6%, an additional 100 deaths could be prevented per year.
Initiatives for Encouraging Cycling in Halifax
The Halifax Regional Municipality is actively investing in the expansion of its walking and cycling infrastructure, focusing on safety, accessibility, and sustainability.
Halifax’s current infrastructure already includes an extensive network of active transportation facilities.
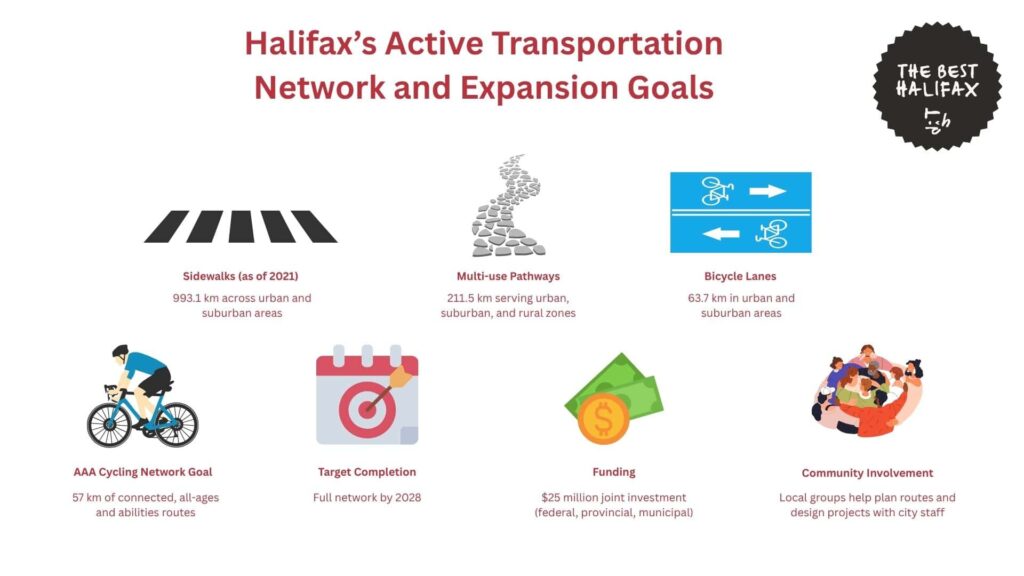
As of April 2021, the city had over 993 kilometers of sidewalks serving urban and suburban areas, along with 211.5 kilometers of multi-use pathways that extend into rural zones.
The cycling network includes 63.7 kilometers of bicycle lanes, 6.4 kilometers of protected bicycle lanes, and 1.4 kilometers of local street bikeways.
These facilities reflect the city’s ongoing effort to connect residential neighborhoods to schools, employment centers, and public services.
The municipality’s most ambitious current project is the development of the All-Ages-and-Abilities (AAA) Cycling Network for the Regional Centre, which aims to create 57 kilometers of safe and connected cycling routes across the Halifax Peninsula.
This network is specifically designed to accommodate people of all ages and abilities, including both new and experienced cyclists.
As of winter 2024, about half of the network had been completed, and the target for full completion is set for 2028.
In the meantime, more than 8 kilometers of interim or tactical bikeway improvements have been implemented to allow for faster deployment and pilot testing of safety measures.
These include temporary traffic calming features, painted lanes, and signage upgrades that can be evaluated before permanent infrastructure is built.
The total cost of the AAA bikeway project is supported by a $25 million joint investment from federal, provincial, and municipal governments through the Investing in Canada Infrastructure Program.
Halifax’s active transportation planning is based on two significant policy documents: the 2014–2019 Halifax Active Transportation Priorities Plan and the 2017 Integrated Mobility Plan (IMP).
These policy documents inform the city in determining priority corridors for investment in infrastructure based on where changes in travel behavior are most likely to take place.
This would include locations where improved cycling and walking infrastructure would decrease the reliance on cars, especially for shorter trips.
What is unique about Halifax’s approach is the inclusion of community cycling organizations in the planning process.
Local groups assist in the identification of possible routes and work with city staff to design and execute projects. These are especially important in places where official planning documents do not yet exist.
Once a route is determined, the city staff conducts public hearings, feasibility studies, and technical reviews to decide how to proceed.
Through close cooperation with both intergovernmental agencies and community stakeholders, Halifax guarantees that newly developed infrastructure is not just technically possible, but also meets local needs.
The Future of Cycling Trends in Halifax
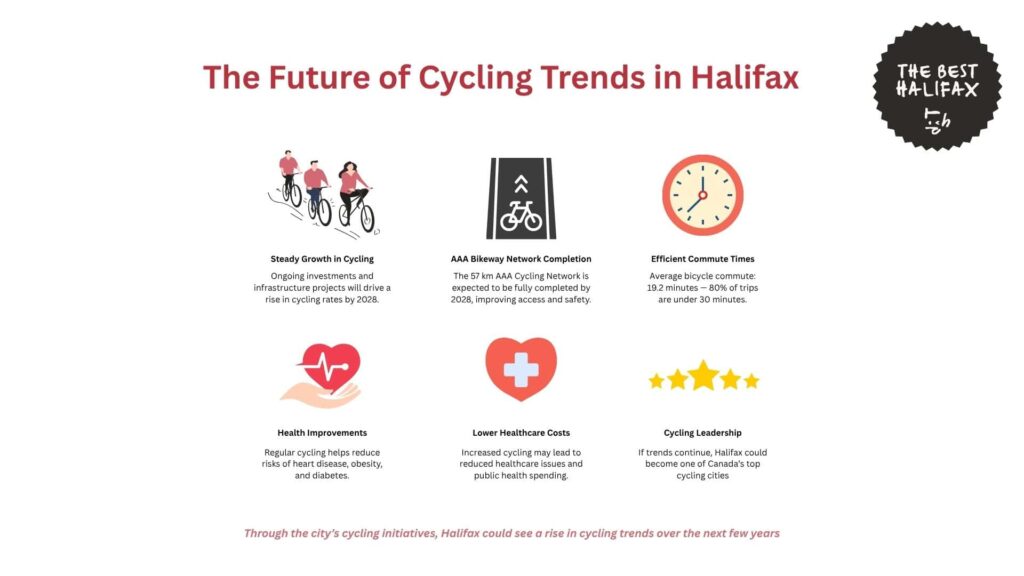
Based on ongoing infrastructure development, commuter statistics, and city investment strategies, cycling in Halifax will grow steadily over the coming years.
With the Regional Centre AAA Bikeway Network coming to completion by 2028, the next years should see increased access and improved safety, which should encourage more regular cycling in the city.
Furthermore, the current average commute time of 19.2 minutes and the reality that more than 80% of bicycle trips are shorter than 30 minutes indicate that cycling continues to be a convenient mode of transport in Halifax.
Together with this rise in cycling patterns, Halifax could also see financial savings and improved physical health for its residents.
As a growing number of commuters trade cars for bicycles, consumers will spend less on fuel, insurance, and maintenance, potentially saving thousands of dollars a year.
Moreover, regular cycling and greater physical activity are linked to reduced occurrences of chronic diseases like heart disease, diabetes, and obesity.
Thus, Halifax might start to see noticeable decreases in healthcare issues and public health expenditure.
If the city’s infrastructure projects continue as planned and cycling remains integrated into urban infrastructure, Halifax can be among Canada’s top-ranked cities for cycling.
References
- Statistics Canada. (2017). Halifax [Census metropolitan area], Nova Scotia and Nova Scotia [Province] (Catalogue no. 98-316-X2016001). https://www12.statcan.gc.ca/census-recensement/2016/dp-pd/prof/details/page.cfm?Lang=E&Geo1=CMACA&Code1=205&Geo2=PR&Code2=12
- Statistics Canada. (2022). Census profile, 2021 census of population: Halifax, Regional municipality (Code 1209034). https://www12.statcan.gc.ca/census-recensement/2021/dp-pd/prof/details/page.cfm?Lang=E&SearchText=halifax&DGUIDlist=2021A00051209034&GENDERlist=1&STATISTIClist=1&HEADERlist=0
- Halifax Regional Municipality. (n.d.). Halifax cycling data dashboard. https://app.powerbi.com/view?r=eyJrIjoiYWM1MjFmNjEtMGM5Zi00NTJkLTkxMGEtODNiZGU1YmY4MGZjIiwidCI6IjA1YjdlN2Q2LWI3MWItNDdkYS05M2VmLWFhYzcyMjNmODllNSIsImMiOjN9&pageName=ReportSection
- Statistics Canada. (2017). Table 1: Direct health care costs attributable to physical inactivity in Canada, by sex and province/territory, 2009. Health Reports, 28(4). https://www150.statcan.gc.ca/n1/pub/82-003-x/2017004/article/14788/tbl/tbl01-eng.htm
- Share the Road Cycling Coalition. (n.d.). The financial benefits of cycling. https://sharetheroad.ca/financial-benefits-of-cycling/
- Toronto Public Health. (2012). Road to health: Improving walking and cycling in Toronto. https://www.toronto.ca/legdocs/mmis/2012/hl/bgrd/backgroundfile-46520.pdf
- Halifax Regional Municipality. (n.d.). Regional Centre AAA bikeway projects. https://www.halifax.ca/transportation/cycling-walking/expanding-network/regional-centre-aaa-bikeway-projects
- Halifax Regional Municipality. (n.d.). Expanding the network. https://www.halifax.ca/transportation/cycling-walking/expanding-network
- Halifax Regional Municipality. (2014). Halifax Active Transportation Priorities Plan: July 2014 final report. https://cdn.halifax.ca/sites/default/files/documents/transportation/transportation-projects/AT_Plan_Final_July222014_000.pdf
- Halifax Regional Municipality. (2017). Integrated Mobility Plan. https://cdn.halifax.ca/sites/default/files/documents/about-the-city/regional-community-planning/IMP_report_171220-WEB.pdf
- Government of Canada. (n.d.). About the Investing in Canada Plan. https://housing-infrastructure.canada.ca/plan/about-invest-apropos-eng.html